A/B Testing Fundraising Emails: What Should Nonprofits Actually Measure?
Fundraising email A/B testing should be judged by what donors do, not by what the email software reports first. Send two versions that differ in one element to randomly split groups of your list, choose one primary metric before you send, and measure clicks, donations and revenue per delivered email, with unsubscribes counted as a cost. Open rates are the weakest signal: since 2021, Apple's Mail Privacy Protection, a privacy feature in Apple Mail, has caused email platforms to record opens that never happened. On a small list, one test is a clue, not a verdict.
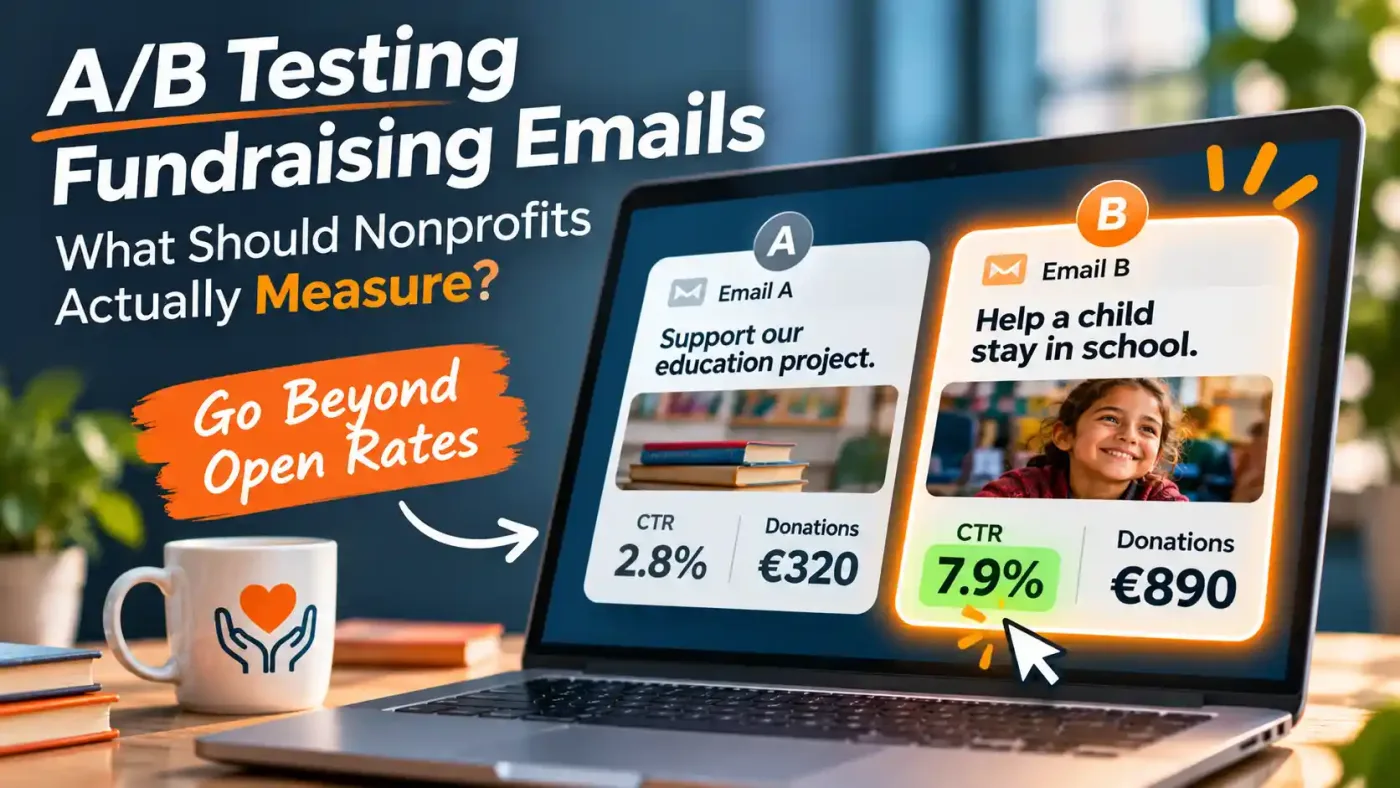
Consider two hypothetical appeals, each delivered to 5,000 supporters:
| Email A | Email B | |
|---|---|---|
| Reported open rate | 42% | 29% |
| Donations raised | €320 | €890 |
| Revenue per 1,000 delivered emails | €64 | €178 |
Illustrative figures for equal, randomly assigned groups. Not results from a real experiment.
Which email performed better? By the number most dashboards show first, Email A. By the number the organisation needs, Email B raised almost three times as much from the same number of people. The gap between those two answers is the subject of this article. Attention (opens), engagement (clicks) and donor action (gifts) are three different things, and only the last one pays for the programme.
What is A/B testing in nonprofit email marketing?
A/B testing is a controlled experiment. You randomly split one audience into two groups, send each group a version of the same email that differs in one element, and compare a metric you chose in advance. Because the groups are random and receive the email at the same time, a difference in results can be traced to the element you changed, not to who received it or when.
How is a test different from comparing two campaigns?
Comparing this December's appeal with last December's is not a test. The two campaigns differ in audience, season, news and dozens of wording choices at once. A comparison like that can raise a question; only a randomised test can start to answer one.
Why testing beats assumptions
Experienced fundraisers can be wrong. In a study of about 500,000 new donors, professionals predicted that thank-you calls would lift retention, and the calls made no measurable difference. A test replaces "we think" with "our supporters did".
Why change one variable at a time?
If Email B has a new subject line, a new story and a new button, and it wins, you know the package worked but not why. Mailchimp, a widely used email marketing platform, builds its A/B tool around this rule: one variable per campaign, chosen from subject line, From name, content or send time.
What small nonprofits should know before testing
Before you start, know how many donations a single send usually produces. In the M+R Benchmarks 2026 study, based on 2025 data from 180 nonprofits, most of them US-based, fundraising emails averaged a 0.59% click-through rate and a 0.05% response rate. On a 3,000-person list split in half, that is about nine clicks and less than one gift per version. Mailchimp recommends at least 5,000 subscribers per variation for reliable results. Most small NGOs don't have that, which changes how they should test (see Step 6).
Which fundraising email elements are worth testing?
Five elements are worth testing in fundraising emails: the subject line, the preview text, the type of appeal, the call to action, and the email's length and layout. They sit at different points between attention and action, so each needs a metric that matches what it can change.
| Element | Example: A vs B | What it mostly affects | Judge it by |
|---|---|---|---|
| Subject line | "Amra's bus pass runs out on 19 December" vs "Our winter appeal" | Whether the email gets noticed | Clicks and gifts, not opens |
| Preview text | Repeats the deadline vs adds the cost (€30 per pass) | Whether the promise feels worth opening | Clicks |
| Appeal type | One child's story vs "All 24 children attended every day this term" | Whether the reader is persuaded | Donation conversion rate |
| Call to action | "Donate Now" vs "Pay for one bus pass: €30" | Whether intent becomes a gift | Donation conversion and revenue per email |
| Length and layout | 120 words and one button vs a 400-word story | Whether the case is clear on a phone | Clicks and donation conversion |
1. Subject lines: what gets attention?
Compare an emotional line with an informational one, or a deadline with an outcome; the fundraising email subject line examples in this series give ten pairs to start from. A subject line that wins on opens and loses on gifts has made a promise the email didn't keep.
2. Preview text: what encourages the next step?
Preview text (the preheader) is the short line shown after the subject line in most inboxes. If you change both at once, you won't know which one moved the result, so test them separately when the goal is to learn what one element does.
3. Emotional vs informational appeals
A story about one person and a message about measurable results persuade in different ways, and neither wins everywhere. Matthew Lindauer and colleagues (2020) found that a well-built rational argument did as well as a classic emotional appeal. Your own list can settle it over several sends.
4. Calls to action: what motivates donations?
"Donate Now" is generic, "Support a Child's Education" ties the gift to a purpose, and "Give Monthly" asks for a commitment. Look at the average gift as well as conversion: a monthly ask may convert fewer people and still be worth more over a year.
5. Email length and layout
Short emails reach the button faster; story-led emails make a fuller case. Check both versions on a phone before sending: a button below three screens of text mostly tests patience.
Which fundraising email metrics actually matter?
The fundraising email metrics that matter most are donation conversion rate and revenue per delivered email, because they measure what donors did. Click-through rate is the best early signal, especially for small lists. Open rate is the least reliable, and unsubscribe rate is the cost side of every test. Calculate all of them against delivered emails, with the same time window and the same rule for which gifts count.
| KPI | Formula | What it tells you |
|---|---|---|
| Open rate | Reported opens ÷ delivered emails × 100 | That the email was loaded, by a person or a machine |
| Click-through rate (CTR) | Unique clicking recipients ÷ delivered emails × 100 | How many people engaged enough to act |
| Donation conversion rate | Donating recipients ÷ delivered emails × 100 | How many people gave |
| Revenue per delivered email | Total attributed donations ÷ delivered emails | What each email was worth |
| Unsubscribe rate | Unsubscribes ÷ delivered emails × 100 | What the send cost in future reach |
M+R calls the donation conversion rate the "response rate". Some platforms also report click-to-open rate (clicks ÷ opens). Avoid it for testing: when opens are inflated, the denominator is wrong.
Open rate: useful but increasingly unreliable
Open rate is now a weak measure of attention. Since iOS 15 in 2021, Apple's Mail Privacy Protection (MPP) has let Apple Mail users hide their email activity. When the feature is on, remote content, including the tracking pixel that records an open, is downloaded privately in the background when the message arrives, not when the person reads it. Apple says the feature prevents senders from seeing whether an email was opened. Litmus, an email analytics company, attributed 76.56% of the opens it tracked in September 2026 to Apple, with privacy-protected opens included. Use opens to spot deliverability problems, such as a sudden drop, not to choose a winner.
Click-through rate: measuring engagement
A click is a deliberate action, and Apple notes that MPP does not extend to links, so clicks still come from what people actually do. For small lists, CTR is often the most useful deciding metric because it produces enough events to compare. Its limit: a click shows interest, not a gift.
Donation conversion rate: measuring donor action
Donation conversion rate is the share of delivered emails that led to at least one gift within your attribution window. It is the metric closest to the purpose of a fundraising email, and the hardest to test on a small list, because gifts are rare. At the M+R average of 0.05%, 3,000 delivered emails produce about one or two gifts.
Revenue per delivered email: measuring financial performance
Revenue per delivered email divides all gifts attributed to an email by the number delivered. It captures both how many people gave and how much, which makes it the best single measure of financial performance. M+R reported an average of $54 for every 1,000 fundraising emails sent in 2025. It is also the most volatile metric, because one large gift can decide the result. Report the average gift and the largest single gift next to it.
Unsubscribe rate: monitoring audience fatigue
A version that raises more today but pushes more people off the list may cost more next quarter. Track unsubscribes and spam complaints for every variant; a clearly higher rate is a reason to question the winner.
Fix the window and the attribution rule first
Every metric above depends on two decisions made before sending: how long you count results (for example, seven days) and which gifts count (for example, gifts through the email's tracked link or with its campaign code). Without them, one version can "win" because a late gift or an offline payment was counted on one side only. A gift made by bank transfer leaves no trace in an email link, so agree with whoever handles donations how such gifts are matched to a campaign.
How do you run your first fundraising email A/B test?
Run your first test in six steps: define one objective, write a hypothesis, build two versions that differ in one element, split the list at random, fix the duration and primary metric before sending, then analyse the result and record it. The record you keep matters more than any single result.
Step 1: define one clear objective
Choose the outcome the email exists for, such as more donors to a winter appeal, rather than more opens. One objective keeps the test honest when results come in mixed.
Step 2: form a testable hypothesis
Write it down before you build anything: "A donor-centred version will produce a higher donation conversion rate than an organisation-centred version." A good hypothesis names the change, the metric and the direction.
Step 3: create two email variations
Copy the email and change only the element in your hypothesis. In a test of donor-centred messaging, keep the subject line, preview text, layout, amount and button identical, and rewrite only the body:
Version A (organisation-centred): Our organisation provides bus passes for 24 children whose village school has closed. €30 covers one pass from January to June.
Version B (donor-centred): You can keep 24 children in school this spring. Your €30 covers one child's bus pass from January to June.
The facts are the same. Only the subject of the sentence has changed.
Step 4: randomly split your audience
Let the platform assign recipients at random, send both versions at the same time, and don't leave a segment out of one side. Mailchimp's "test a sample, then send the winner" mode needs at least 10% of the list for the test. On a small list, a 50/50 split of the whole list tells you more.
Step 5: set the test duration and success metric
Decide before sending how long you will count results and which metric decides. Platform defaults are built for opens and clicks: Mailchimp suggests waiting one to three hours for click tests and 12 to 24 hours for revenue tests, and those figures assume 5,000 or more recipients per variation. Donations arrive more slowly. My default for a fundraising test is seven days, applied to both versions.
Step 6: analyse results and document what you learned
First ask whether the difference could be chance. With a handful of donations, it usually could. A rough rule from statistician Evan Miller gives the recipients needed per version: 16 × p(1 − p) ÷ d², where p is your usual rate and d is the smallest difference worth detecting. That gives roughly an 80% chance of spotting a real difference at the usual 5% significance level. At M+R's 0.05% response rate, detecting a 50% rise in gifts needs about 128,000 recipients per version. Detecting the same 50% rise in clicks at 0.59% needs about 11,000.
Then record the hypothesis, both versions, the numbers, the decision and what you will test next. On a small list, avoid declaring a winner from a few conversions. Five logged tests of the same question are evidence; one is an anecdote.
Case study: what can two donation emails actually prove?
The case is hypothetical. A small education NGO with about 6,000 email supporters is raising money for bus passes for children whose village school has closed. It splits the list at random and tests organisation-centred copy (A) against donor-centred copy (B), with everything else identical. Gifts are counted for seven days through the email's tracked link.
| Email A: organisation-centred | Email B: donor-centred | |
|---|---|---|
| Delivered | 2,980 | 2,975 |
| Unique clickers | 21 | 34 |
| Donors | 6 | 11 |
| Revenue | €270 | €410 |
| Unsubscribes | 5 | 6 |
| CTR | 0.70% | 1.14% |
| Donation conversion rate | 0.20% | 0.37% |
| Revenue per delivered email | €0.09 | €0.14 |
| Average gift | €45.00 | €37.27 |
| Unsubscribe rate | 0.17% | 0.20% |
The donation rates here are four to seven times the M+R average, which makes the example generous. On a list that behaves like the average, each version would have produced one or two gifts.
What the data suggests. B drew more clickers (34 against 21) and more donors (11 against 6), with almost identical unsubscribes. Both metrics point the same way, so the result is worth taking seriously.
What it can't prove. A standard two-proportion test gives a p-value of about 0.08 for clicks and 0.22 for donors. In plain terms, if both versions were equally good, a gap in donors this large would still appear about one time in five. Revenue is weaker still: A's €270 includes one €150 gift, so a single donor decides that comparison. To detect a difference in donation rate of this size reliably, each version would need about 11,000 recipients. The test also can't say whether B's donors will give again, whether bank transfers prompted by A went uncounted, or whether donor-centred copy wins for every appeal.
What the team should do. Keep donor-centred copy as the working default, since it is the better bet and costs nothing extra, log the result, and run the same comparison in the next two appeals. If B leads again, the pattern starts to become evidence.
What A/B testing mistakes should nonprofits avoid?
Five mistakes cause most bad conclusions in nonprofit email testing: changing several things at once, trusting tiny samples, picking winners by opens, letting the two audiences differ, and stopping a test as soon as one version pulls ahead.
Testing too many variables
If the two versions differ in subject line, story and button, a win tells you nothing you can reuse. Change one element, or admit that you are choosing between two finished emails rather than learning.
Drawing conclusions from small samples
Six donors against eleven feels like a clear result. It isn't. My rule of thumb: when either version has fewer than a few dozen of the events you are measuring, treat the result as a lead to repeat, not a decision.
Focusing only on open rates
Opens are inflated by Mail Privacy Protection and say nothing about giving. A subject line can win on opens and lose on gifts, as the opening example shows.
Changing the audience between variants
Sending A to donors and B to newsletter subscribers, or A on Tuesday and B on Friday, measures the audience or the day, not the email.
Stopping tests too early
Checking results every hour and stopping when one version leads makes false winners far more likely. In one of Evan Miller's simulations, stopping at the first "significant" result pushed the false positive rate from the intended 5% to about 26%. Set the window in advance and wait for it.
Which metric should decide a test on a small list?
Every fundraising test faces a trade-off. The metrics closest to money (donors, revenue) produce the fewest events, so they need the largest lists. The metric with the most events (opens) is furthest from money and the least trustworthy. I call the way through this the Fundraising Signal Ladder: let the highest rung your list can actually measure decide the test, and report the rungs above it without letting them decide.
| Rung | Metric | Events per 3,000 delivered emails at M+R averages | Use it to decide when |
|---|---|---|---|
| 4 | Revenue per delivered email | Same gifts as rung 3, and one large gift can swing it | Each version reaches tens of thousands, or you pool several sends |
| 3 | Donation conversion rate | About 1 or 2 donors | Each version reaches tens of thousands, or you pool several sends |
| 2 | Click-through rate | About 18 clickers | Each version reaches a few thousand people, or you pool two or three sends |
| 1 | Open rate | Inflated by MPP | Never for a fundraising decision; use it only to check deliverability |
| Guard rail | Unsubscribe rate | Always reported | Never the goal; a clear rise can veto a winner |
A list of 3,000 should let clicks decide, pooled across two or three sends, and track donors and revenue alongside. At average response rates, even a list of 100,000 is too small for donations to show a 50% rise in a single send. No list should let opens decide.
Pre-send A/B testing checklist
Run through these seven checks before every test.
- [ ] I defined one measurable fundraising objective.
- [ ] I selected one primary success metric.
- [ ] I prepared two comparable email versions.
- [ ] I randomly assigned recipients to test groups.
- [ ] I defined the test duration and donation attribution window.
- [ ] I checked whether the sample is sufficient for a reliable conclusion.
- [ ] I documented results and the next improvement.
My view: test less, record more
In my view, the biggest problem with nonprofit A/B testing is not that small teams test too little. It is that they test in a way that can't answer the question, then act on the answer anyway: more opens after two hours, winner sent to everyone, decision called data-driven. I would rather see fewer tests, each with a written hypothesis and a fixed window, and a log kept for a whole year. Twelve logged comparisons of clicks and gifts will tell a small organisation more about its own supporters than any benchmark report, including the ones cited here.
What to do next
- Take your last five fundraising emails and calculate CTR, donation conversion rate and revenue per delivered email for each, all against delivered emails. That is your baseline.
- Agree with whoever handles donations what counts as a gift from an email: the window (for example, seven days), the link or campaign code, and how bank transfers are matched.
- Write one hypothesis for your next appeal in a single sentence that names the change, the metric and the direction.
- Set up a shared test log with eight columns: date, hypothesis, element tested, delivered per version, clickers, donors, revenue and decision.
- Plan to repeat the same comparison in your next two appeals before you change your standard approach.
Conclusion: measure donor action, not just attention
Email platforms make it easy to run a test and just as easy to read it wrongly. The usual mistake is to treat the number that arrives first, the open rate, as the answer. A/B testing is not a feature you switch on before a send. It is a habit: ask one clear question at a time, measure what donors did, and admit when a list is too small for one send to decide. Kept up for a year, that habit produces something no benchmark can: evidence about your own supporters.
Frequently asked questions
What is A/B testing in fundraising emails?
A/B testing in fundraising emails is a controlled experiment in which an organisation sends two versions of one appeal, differing in a single element, to randomly split groups of its list, then compares a metric chosen in advance. Random assignment and simultaneous sending mean a difference in clicks, donations or revenue can be linked to the change rather than to the audience or the timing.
How many subscribers do you need for a reliable A/B test?
It depends on how often the event you measure happens. A rough rule from Evan Miller is 16 × p(1 − p) ÷ d² recipients per version. At typical fundraising rates, detecting a 50% rise in clicks needs about 11,000 recipients per version, and a 50% rise in gifts about 128,000. Mailchimp recommends at least 5,000 per variation. Smaller lists should judge by clicks and repeat comparisons across sends.
What is the most important fundraising email metric?
Revenue per delivered email is the best single measure of a fundraising email's financial performance, because it combines how many people gave and how much. Donation conversion rate is a close second. Both need large samples, so small lists often let click-through rate decide a test and track gifts and revenue alongside it. Open rate should never decide a fundraising test.
How long should an email A/B test run?
Long enough to capture most of the result you are measuring, and the same length for both versions. Platform defaults of a few hours suit opens and clicks. Donations arrive more slowly, so fundraising tests usually need a window of several days, for example seven. Set the window before sending, and don't stop early because one version is ahead, which makes false winners more likely.
Can small nonprofits benefit from A/B testing?
Yes, if they adapt the method. A small list rarely produces enough donations in one send to pick a reliable winner. Small nonprofits should test one element at a time, judge by clicks while tracking gifts, repeat the same comparison over several appeals and keep a simple log. The pattern across sends is evidence; a single result is only a lead.
Sources
- Apple, Use Mail Privacy Protection on iPhone: what MPP hides, and that it does not extend to links.
- Apple, Use Mail Privacy Protection on Mac: remote content downloaded privately in the background when a message is received.
- Apple, If you see "Unable to load remote content privately": MPP in iOS 15, iPadOS 15 and later.
- Mailchimp, About A/B tests: variables, random assignment and winner criteria (open rate, click rate, total revenue or manual).
- Mailchimp, Email A/B testing: 10% minimum test size, 5,000 subscribers per variation recommended, test durations, one variable per campaign.
- Miller, E. How Not To Run an A/B Test: stopping early, false positive inflation, sample size rule of thumb.
- M+R, Benchmarks 2026: Email Messaging (2025 data from 180 nonprofits, mostly US-based): fundraising email click-through rate, response rate and revenue per 1,000 emails sent.
- Litmus, Email Client Market Share: Apple's share of tracked opens, September 2026, privacy-protected opens included.
- Lindauer, M., Mayorga, M., Greene, J., Slovic, P., Västfjäll, D. and Singer, P. (2020). Comparing the Effect of Rational and Emotional Appeals on Donation Behavior. Judgment and Decision Making, 15(3), 413-420.
- Samek, A. and Longfield, C. (2023). Do Thank-You Calls Increase Charitable Giving? Expert Forecasts and Field Experimental Evidence. American Economic Journal: Applied Economics, 15(2), 103-124.
About the author
Milan Bogojević writes about fundraising, grant strategy and practical AI for small and mid-size nonprofits on milanbogojevic.com.
Last updated
10 November 2026 - First published.
Questions people ask about this
What is A/B testing in fundraising emails?
A/B testing in fundraising emails is a controlled experiment in which an organisation sends two versions of one appeal, differing in a single element, to randomly split groups of its list, then compares a metric chosen in advance. Random assignment and simultaneous sending mean a difference in clicks, donations or revenue can be linked to the change rather than to the audience or the timing.
How many subscribers do you need for a reliable A/B test?
It depends on how often the event you measure happens. A rough rule from Evan Miller is 16 × p(1 − p) ÷ d² recipients per version. At typical fundraising rates, detecting a 50% rise in clicks needs about 11,000 recipients per version, and a 50% rise in gifts about 128,000. Mailchimp recommends at least 5,000 per variation. Smaller lists should judge by clicks and repeat comparisons across sends.
What is the most important fundraising email metric?
Revenue per delivered email is the best single measure of a fundraising email's financial performance, because it combines how many people gave and how much. Donation conversion rate is a close second. Both need large samples, so small lists often let click-through rate decide a test and track gifts and revenue alongside it. Open rate should never decide a fundraising test.
How long should an email A/B test run?
Long enough to capture most of the result you are measuring, and the same length for both versions. Platform defaults of a few hours suit opens and clicks. Donations arrive more slowly, so fundraising tests usually need a window of several days, for example seven. Set the window before sending, and don't stop early because one version is ahead, which makes false winners more likely.
Can small nonprofits benefit from A/B testing?
Yes, if they adapt the method. A small list rarely produces enough donations in one send to pick a reliable winner. Small nonprofits should test one element at a time, judge by clicks while tracking gifts, repeat the same comparison over several appeals and keep a simple log. The pattern across sends is evidence; a single result is only a lead.
Where this comes from
- Apple, Use Mail Privacy Protection on iPhone support.apple.com
- Apple, Use Mail Privacy Protection on Mac support.apple.com
- Apple, If you see "Unable to load remote content privately" support.apple.com
- Mailchimp, About A/B tests mailchimp.com
- Mailchimp, Email A/B testing mailchimp.com
- Evan Miller, How Not To Run an A/B Test www.evanmiller.org
- M+R, Benchmarks 2026: Email Messaging mrbenchmarks.com
- Litmus, Email Client Market Share www.litmus.com
- Lindauer et al. (2020), Comparing the Effect of Rational and Emotional Appeals on Donation Behavior, Judgment and Decision Making doi.org
- Samek and Longfield (2023), Do Thank-You Calls Increase Charitable Giving? Expert Forecasts and Field Experimental Evidence doi.org